


 30 / 35

JANUARY
FEBRUARY
MARCH
APRIL
MAY
JUNE
JULY
AUGUST
SEPTEMBER
OCTOBER
NOVEMBER
DECEMBER
0
60
80
100
120
140
160
105
103
117
107
103
146
109
131
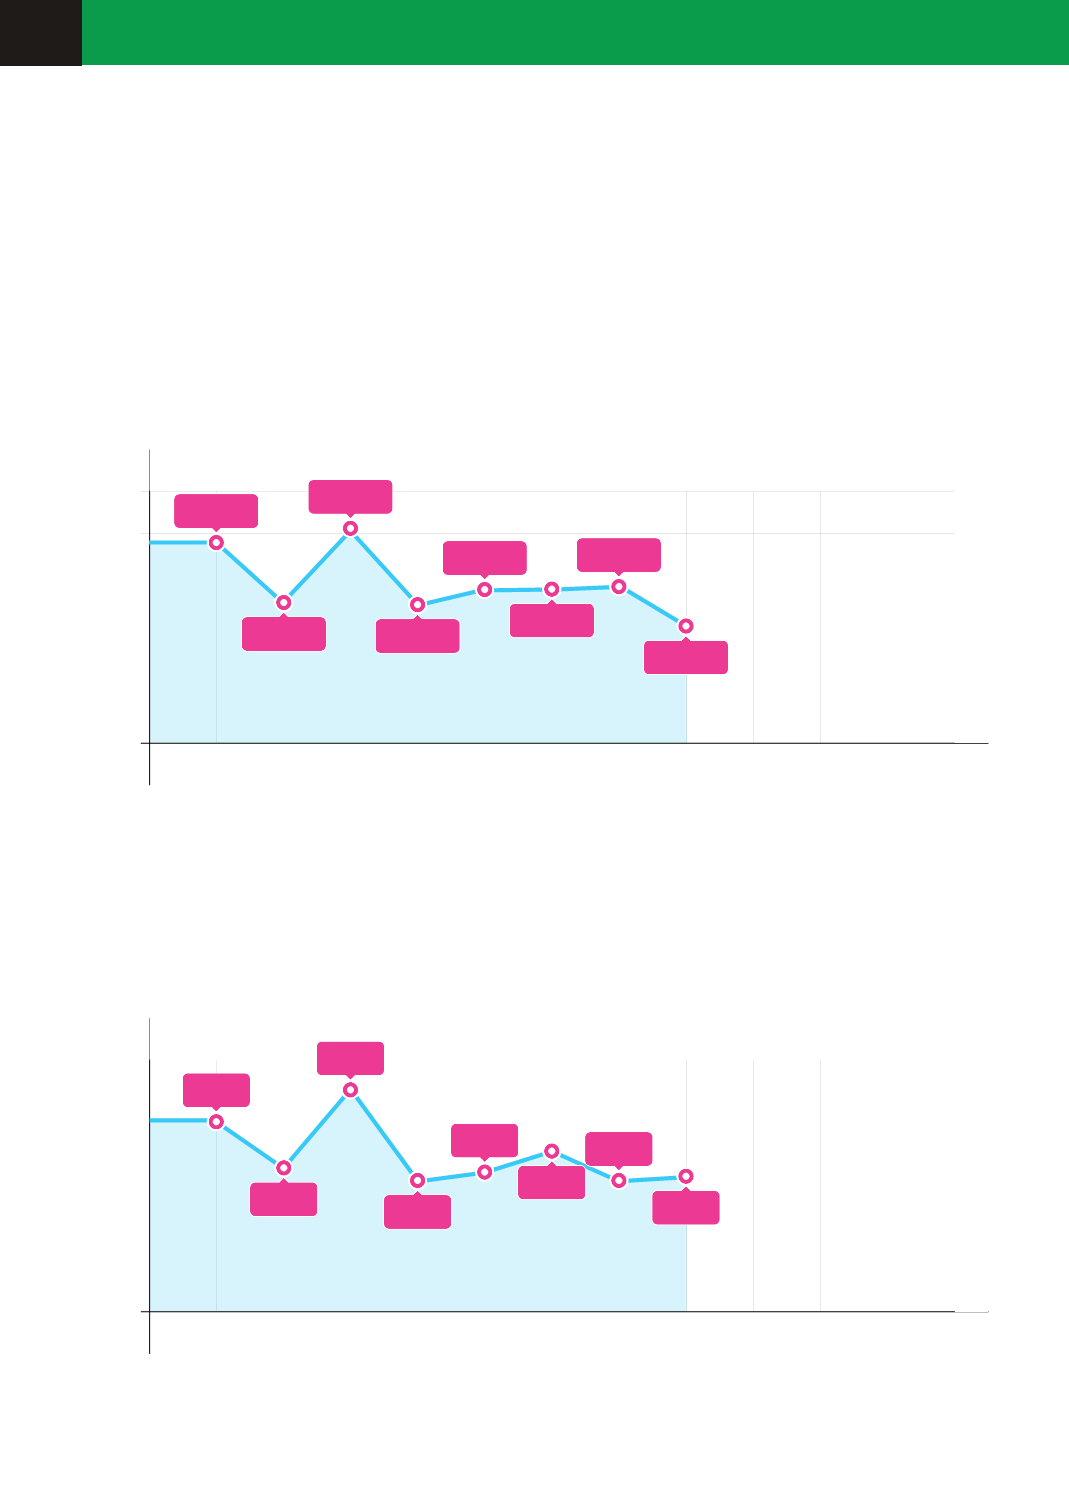
NUMBER OF DEMANDS
(Daily, 2013)
When the monthly and daily number of demands is examined, it is seen that there is an increase in
demand as of March. It has been seen that the reason for this increase was the chassis number control
added to traffic insurance renewals.
JANUARY
FEBRUARY
MARCH
APRIL
MAY
JUNE
JULY
AUGUST
SEPTEMBER
OCTOBER
NOVEMBER
DECEMBER
0
1000
1500
2000
2500
3000
3500
1893
2373
2348
2346
2154
3056
2180
2887
NUMBER OF DEMANDS
(Mothly, 2013)
We, Insurance Information and Monitoring center, have developed SBM Demand Management System
(TYS) in order to provide “online", traceable and quicker service to our business partner insurance
companies. TYS Platform has been put into operation in the second half of 2010.
The monthly and daily statistics of Demand Management System up to August 2013 are shown in the
following diagrams.
Demand Management System Statistics
REPORTS
30